Monitoring: Difference between revisions
No edit summary |
|||
| (2 intermediate revisions by the same user not shown) | |||
| Line 59: | Line 59: | ||
==== Prerequisites ==== | ==== Prerequisites ==== | ||
Ubuntu Linux machine, sudo access and some Linux beginner skills are needed. | Ubuntu Linux machine, sudo access and some Linux beginner skills are needed. | ||
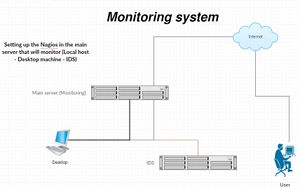
[[File:Screenshot from 2016-11-11 14-33-23.jpg|thumb|300px| Nagios monitoring system]] | |||
Unfortunately, Nagios cannot be installed simply by using one command, because there are some prerequisite applications needed for it to work. | Unfortunately, Nagios cannot be installed simply by using one command, because there are some prerequisite applications needed for it to work. | ||
Latest revision as of 14:57, 11 November 2016
Team: Mohanad Aly, Artur Ovtsinnikov
Group : Cyber Security Engineering (C21)
Page Created: 23 October 2016
Last modified: 11 November 2016
Introduction
This article introduces the Monitoring application called Nagios.
Monitoring
Monitoring is the process of keep tracking of system resources.
Monitoring is the process of observing and checking the progress or quality of something over a period of time; keep under systematic review.[1] Monitoring cannot be achieved without logging. That is the reason integrated solutions combine the two processes. Monitoring is used to:
- check performance
- detect if something worth noticing happened
- prevent something to happen
- detect whether a system is under attack
The good solution: Nagios
As of today, [1] is the most popular open-source solution for monitoring computer systems before
Monitoring is made of three components:
- Apache
- PHP
- MySQL
The main advantages of Nagios are:
- Open-source
- Customized Dashboards
- Ease of Use
- Infinite Scalability
- Data in Real Time
- Network Security
Why monitor our servers
There are many reasons why a system administrator would want to monitor its server(s).
- Prevent undesired events to happen
Without monitoring, a system administrator will react to a problem only when it has already occurred. Such issue can in the worst case cause a failure of the CIA triad. It is of course wiser to anticipate such issues and solve the problem before they arise. The monitoring system sends alerts that help to identify potential sources of futures failures to avoid.
- Understand what happened in case of failure
In the event of a system failure, the monitoring system will give crucial information to determine where, when and how the problems occurred. This information makes the debugging process to be much faster and easier.
In the end, monitoring a system can be seen as an insurance policy. It costs money and time, but the money and time it saves is worth it.
Setup of Nagios
In this tutorial, Ubuntu 16.04 64-bit distribution will be used since it is the latest LTS.
Prerequisites
Ubuntu Linux machine, sudo access and some Linux beginner skills are needed.
Unfortunately, Nagios cannot be installed simply by using one command, because there are some prerequisite applications needed for it to work.
This tutorial describes the commands and configuration to make the services work together Nagios.
- It is important to have the latest package lists to update them to get info on the newest versions of packages and their dependencies. So we need to run the following command to update them:
Command
sudo apt-get update
Installing the prerequisites
- Nagios requires the gcc compiler and build-essentials for the compilation, LAMP (Apache, PHP, MySQL) for the Nagios web interface and Send mail to send alerts from the server. To install all those packages, run this command (it's just 1 line):
Command
sudo apt-get install wget build-essential apache2 php apache2-mod-php7.0 php-gd libgd-dev sendmail unzip
User and group configuration
- For Nagios to run, you have to create a new user for Nagios. We will name the user "nagios" and additionally create a group named "nagcmd". We add the new user to the group as shown below:

3- Command
useradd nagios
4- Command
groupadd nagcmd
5- Command
usermod -a -G nagcmd nagios
6- Command
usermod -a -G nagios,nagcmd www-data
Installing Nagios
- Step 1 - Download and extract the Nagios core
cd ~
wget https://assets.nagios.com/downloads/nagioscore/releases/nagios-4.2.0.tar.gz
tar -xzf nagios*.tar.gz
cd nagios-4.2.0
- Step 2 - Compile Nagios
Before you build Nagios, you will have to configure it with the user and the group you have created earlier.
./configure --with-nagios-group=nagios --with-command-group=nagcmd
For more information please use: ./configure --help .
- Now to install Nagios:
make all
sudo make install
sudo make install-commandmode
sudo make install-init
sudo make install-config
/usr/bin/install -c -m 644 sample-config/httpd.conf /etc/apache2/sites-available/nagios.conf
- And copy evenhandler directory to the nagios directory:
cp -R contrib/eventhandlers/ /usr/local/nagios/libexec/
chown -R nagios:nagios /usr/local/nagios/libexec/eventhandlers
- Step 3 - Install the Nagios Plugins
Download and extract the Nagios plugins:
cd ~
wget https://nagios-plugins.org/download/nagios-plugins-2.1.2.tar.gz
tar -xzf nagios-plugins*.tar.gz
cd nagios-plugins-2.1.2/
- Install the Nagios plugin's with the commands below:
./configure --with-nagios-user=nagios --with-nagios-group=nagios --with-openssl
make
make install
- Step 4 - Configure Nagios
After the installation phase is complete, you can find the default configuration of Nagios in /usr/local/nagios/. We will configure Nagios and Nagios contact. Edit default nagios configuration with nano:
nano /usr/local/nagios/etc/nagios.cfg
uncomment line 51 for the host monitor configuration.
- cfg_dir=/usr/local/nagios/etc/servers

Save and exit. Add a new folder named servers:
mkdir -p /usr/local/nagios/etc/servers
Change the user and group for the new folder to nagios:
chown nagios:nagios /usr/local/nagios/etc/servers
The Nagios contact can be configured in the contact.cfg file. To open it use:
nano /usr/local/nagios/etc/objects/contacts.cfg
Then replace the default email with your own email.
Configuring Apache
- Step 1 - enable Apache modules
sudo a2enmod rewrite
sudo a2enmod cgi
You can use the htpasswd command to configure a user nagiosadmin for the nagios web interface
sudo htpasswd -c /usr/local/nagios/etc/htpasswd.users nagiosadmin
and type your password.
- Step 2 - enable the Nagios virtualhost
sudo ln -s /etc/apache2/sites-available/nagios.conf /etc/apache2/sites-enabled/
- Step 3 - Start Apache and Nagios
service apache2 restart
Start the nagios (if not working look down, there is solution)
service nagios start
When Nagios starts, you may see the following error :
- Starting nagios (via systemctl): nagios.serviceFailed
And this is how to fix it:
cd /etc/init.d/
cp /etc/init.d/skeleton /etc/init.d/nagios
Now edit the Nagios file:
nano /etc/init.d/nagios
and add the following code:
DESC="Nagios"
NAME=nagios
DAEMON=/usr/local/nagios/bin/$NAME
DAEMON_ARGS="-d /usr/local/nagios/etc/nagios.cfg"
PIDFILE=/usr/local/nagios/var/$NAME.lock
Make it executable and start Nagios:
chmod +x /etc/init.d/nagios
service apache2 restart
service nagios start
- If on this step you are unable to start nagios (nagios.service not found) do the following:
First we are going to create/change the nagios.service :
nano /etc/systemd/system/nagios.service
this file should be the same as the following:
[Unit]
Description=Nagios
BindTo=network.target

[Install]
WantedBy=multi-user.target

[Service]
User=nagios
Group=nagios
Type=simple
ExecStart=/usr/local/nagios/bin/nagios /usr/local/nagios/etc/nagios.cfg
Then we need to enable created nagios.service config :
systemctl enable /etc/systemd/system/nagios.service
Now it should work:
service nagios start
Testing the Nagios Server
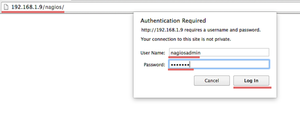
Please open your browser and access the Nagios server ip, in my case: http://192.168.56.200/nagios.
Nagios Login with apache htpasswd.
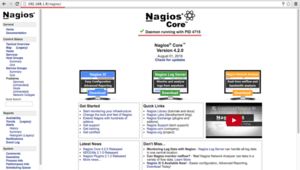
Nagios Admin Dashboard
- Adding a Host to Monitor
In this tutorial, I will add an Ubuntu host to monitor to the Nagios server we have made above.
Nagios Server IP : 192.168.56.200 Ubuntu Host IP : 192.168.56.100
- Step 1 - Connect to ubuntu host
ssh student@192.168.56.100
- Step 2 - Install NRPE Service
sudo apt-get install nagios-nrpe-server nagios-plugins
- Step 3 - Configure NRPE
After the installation is complete, edit the nrpe file /etc/nagios/nrpe.cfg:
nano /etc/nagios/nrpe.cfg
and add Nagios Server IP 192.168.56.100 to the server_address.
server_address=192.168.56.200
- Step 4 - Restart NRPE
service nagios-nrpe-server restart
- Step 5 - Add Ubuntu Host to Nagios Server
Connect back to the Nagios server:
ssh student@192.168.56.200
Then create a new file for the host configuration in /usr/local/nagios/etc/servers/.
nano /usr/local/nagios/etc/servers/ubuntu_host.cfg
Add the following lines:
#Ubuntu Host configuration file

define host {
        use                          linux-server
        host_name                    ubuntu_host
        alias                        Ubuntu Host
        address                      192.168.56
        register                     1
}

define service {
      host_name                       ubuntu_host
      service_description             PING
      check_command                   check_ping!100.0,20%!500.0,60%
      max_check_attempts              2
      check_interval                  2
      retry_interval                  2
      check_period                    24x7
      check_freshness                 1
      contact_groups                  admins
      notification_interval           2
      notification_period             24x7
      notifications_enabled           1
      register                        1
}

define service {
      host_name                       ubuntu_host
      service_description             Check Users
      check_command           check_local_users!20!50
      max_check_attempts              2
      check_interval                  2
      retry_interval                  2
      check_period                    24x7
      check_freshness                 1
      contact_groups                  admins
      notification_interval           2
      notification_period             24x7
      notifications_enabled           1
      register                        1
}

define service {
      host_name                       ubuntu_host
      service_description             Local Disk
      check_command                   check_local_disk!20%!10%!/
      max_check_attempts              2
      check_interval                  2
      retry_interval                  2
      check_period                    24x7
      check_freshness                 1
      contact_groups                  admins
      notification_interval           2
      notification_period             24x7
      notifications_enabled           1
      register                        1
}

define service {
      host_name                       ubuntu_host
      service_description             Check SSH
      check_command                   check_ssh
      max_check_attempts              2
      check_interval                  2
      retry_interval                  2
      check_period                    24x7
      check_freshness                 1
      contact_groups                  admins
      notification_interval           2
      notification_period             24x7
      notifications_enabled           1
      register                        1
}

define service {
      host_name                       ubuntu_host
      service_description             Total Process
      check_command                   check_local_procs!250!400!RSZDT
      max_check_attempts              2
      check_interval                  2
      retry_interval                  2
      check_period                    24x7
      check_freshness                 1
      contact_groups                  admins
      notification_interval           2
      notification_period             24x7
      notifications_enabled           1
      register                        1

}
You can find many check_command in /usr/local/nagios/etc/objects/commands.cfg file. See there if you want to add more services like DHCP, POP etc.
And now check the configuration:
/usr/local/nagios/bin/nagios -v /usr/local/nagios/etc/nagios.cfg
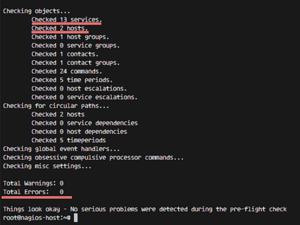
To see if the configuration is correct.
- Step 6 - Restart all services
On the Ubuntu Host start NRPE Service:
service nagios-nrpe-server restart
The Nagios server, start Apache and Nagios:
service apache2 restart
service nagios restart
- Step 7 - Testing the Ubuntu Host
Open the Nagios server from the browser and see the ubuntu_host being monitored. The Ubuntu host is available on monitored host.

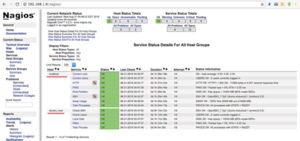
All services monitored without error.
Summary
Nagios is an open source application for monitoring a system. Nagios has been widely used because of the ease of configuration. Nagios in support by various plugins, and you can even create your own plugins. Look here for more information.
See also
Nagios agent setup
3-Ubuntu-and-Debian-Linux-Agent
References