Monitoring Nagios: Difference between revisions
No edit summary |
|||
| (26 intermediate revisions by 2 users not shown) | |||
| Line 7: | Line 7: | ||
Page Created: 10 November 2016 | Page Created: 10 November 2016 | ||
Last modified: | Last modified: 05 January 2017 | ||
= Introduction = | = Introduction = | ||
| Line 14: | Line 14: | ||
===Monitoring=== | ===Monitoring=== | ||
Server monitoring is basically scanning of the servers and network for detection of any issues, but it also monitors for user load, security and speed, if we are talking about web servers monitoring. | |||
===Why monitoring is important?=== | |||
Monitoring is important because it helps to detect the problem and prevent servers to go down, because any network crashes costs not only money but also time, so monitoring will ensure service availability. | |||
===Nagios=== | |||
Nagios is an open source application for system and networks monitoring and at the same time Nagios is one of the most popular solution for the monitoring. | |||
With the Nagios you are able to: | |||
*Detect problems | |||
*Repair Problems | |||
*Plan system upgrades before outdated system will fail | |||
*Respond to issues as soon as they appeared | |||
*Monitor entire infrastructure | |||
= Before You Begin = | = Before You Begin = | ||
| Line 177: | Line 194: | ||
<code>sudo chown nagios:nagios /usr/local/nagios/etc/servers</code> | <code>sudo chown nagios:nagios /usr/local/nagios/etc/servers</code> | ||
[[File:Nagios3.png|thumb|right|Nagios Email]] | [[File:Nagios3.png|thumb|right|[https://www.howtoforge.com/tutorial/ubuntu-nagios/#step-configure-nagios/ Nagios Email]]] | ||
===Configure Nagios Contacts=== | ===Configure Nagios Contacts=== | ||
Open the Nagios contacts configuration in your favorite text editor(nano/vim). | Open the Nagios contacts configuration in your favorite text editor(nano/vim). | ||
| Line 260: | Line 278: | ||
= Testing the Nagios Server = | = Testing the Nagios Server = | ||
Open your favorite web browser, and go to your Nagios server (substitute the IP address or hostname) | Open your favorite web browser, and go to your Nagios server (substitute the IP address or hostname) | ||
| Line 269: | Line 290: | ||
We used "nagiosadmin" as the username: | We used "nagiosadmin" as the username: | ||
[[File:Htpasswd_prompt.png|thumb|center|Nagios Authentication page]] | [[File:Htpasswd_prompt.png|thumb|center|[https://www.howtoforge.com/tutorial/ubuntu-nagios/ Nagios Authentication page]]] | ||
After authenticating, you will be see the default Nagios home page: | After authenticating, you will be see the default Nagios home page: | ||
[[File:Nagios_adminpage.png|thumb|center|Nagios Homepage]] | [[File:Nagios_adminpage.png|thumb|center|[https://www.howtoforge.com/tutorial/ubuntu-nagios/ Nagios Homepage]]] | ||
In the Homepage, click on the Hosts link, in the left navigation bar, to see which hosts Nagios is monitoring: | In the Homepage, click on the Hosts link, in the left navigation bar, to see which hosts Nagios is monitoring: | ||
[[File:Hosts_link.png|thumb|center|Nagios Hostpage]] | [[File:Hosts_link.png|thumb|center| [https://www.howtoforge.com/tutorial/ubuntu-nagios/ Nagios Hostpage]]] | ||
As you can see, Nagios is monitoring only "localhost", or itself. | As you can see, Nagios is monitoring only "localhost", or itself. | ||
| Line 315: | Line 336: | ||
Open it in your favorite editor (we're using nano): | Open it in your favorite editor (we're using nano): | ||
<code>nano /etc/nagios/nrpe.cfg</code> | <code> sudo nano /etc/nagios/nrpe.cfg</code> | ||
Find the ''server_address'' directive, and add the private IP address of your Nagios server | Find the ''server_address'' directive, and add the private IP address of your Nagios server | ||
| Line 325: | Line 346: | ||
Save and exit. | Save and exit. | ||
[[File:5.png|thumb|center|Configure NRPE]] | |||
[[File:5.png|thumb|center| [https://www.howtoforge.com/tutorial/ubuntu-nagios/ Configure NRPE]]] | |||
===Restart NRPE=== | ===Restart NRPE=== | ||
| Line 341: | Line 363: | ||
Then create a new file for the host configuration in ''/usr/local/nagios/etc/servers/''. | Then create a new file for the host configuration in ''/usr/local/nagios/etc/servers/''. | ||
<code>nano /usr/local/nagios/etc/servers/ubuntu_host.cfg</code> | <code> sudo nano /usr/local/nagios/etc/servers/ubuntu_host.cfg</code> | ||
Add the following lines: | Add the following lines: | ||
| Line 351: | Line 373: | ||
host_name ubuntu_host | host_name ubuntu_host | ||
alias Ubuntu Host | alias Ubuntu Host | ||
address 192.168.1. | address 192.168.1.100 | ||
register 1 | register 1 | ||
} | } | ||
| Line 444: | Line 466: | ||
... to see if the configuration is correct. | ... to see if the configuration is correct. | ||
[[File:Nagios_check.png|thumb|center|Nagios check]] | |||
[[File:Nagios_check.png|thumb|center| [https://www.howtoforge.com/tutorial/ubuntu-nagios/ Nagios check]]] | |||
===Restart all services=== | ===Restart all services=== | ||
| Line 461: | Line 484: | ||
= Testing the Ubuntu Host = | = Testing the Ubuntu Host = | ||
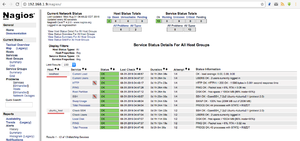
Open the Nagios server from the browser and see the ubuntu_host being monitored. | Open the Nagios server from the browser and see the ubuntu_host being monitored. | ||
| Line 466: | Line 491: | ||
The Ubuntu host is available on monitored host. | The Ubuntu host is available on monitored host. | ||
[[File:Nagios.png|thumb|center|Nagios Testing Host]] | [[File:Nagios.png|thumb|center| [https://www.howtoforge.com/tutorial/ubuntu-nagios/ Nagios Testing Host]]] | ||
All services monitored without error. | All services monitored without error. | ||
[[File:Nagios ubuntu.png|thumb|center|Nagios Testing Host]] | [[File:Nagios ubuntu.png|thumb|center| [https://www.howtoforge.com/tutorial/ubuntu-nagios/ Nagios Testing Host]]] | ||
= Summary = | = Summary = | ||
Nagios is an open application for systems monitoring. | |||
It has several advantages, but main of them are: | |||
*Easy to install and configure | |||
*Easy to to use | |||
*Supports extensions and plugins | |||
= Reference = | = Reference = | ||
| Line 486: | Line 516: | ||
5- [https://nagios-plugins.org/doc/guidelines.html Nagios Plugins] | 5- [https://nagios-plugins.org/doc/guidelines.html Nagios Plugins] | ||
6- [http://www.monitance.com/en/product-news/what-is-server-monitoring-and-why-is-it-important/ Introduction Monitoring ] | |||
7- [https://www.nagios.org/about/overview/ Introduction Nagios ] | |||
------ | ------ | ||
[[Category:Monitoring]] | [[Category:Monitoring]] | ||
Latest revision as of 11:39, 5 January 2017
Team: Ilja Shustov, Sheela Raj
Group : Cyber Security Engineering (C21)
Page Created: 10 November 2016
Last modified: 05 January 2017
Introduction
In this article, we will cover the installation of Nagios, a very popular open source monitoring system, on Ubuntu. We will cover some basic configuration, so you will be able to monitor host resources via the web interface. We will also utilize the Nagios Remote Plugin Executor (NRPE), that will be installed as an agent on remote hosts, to monitor their local resources.
Monitoring
Server monitoring is basically scanning of the servers and network for detection of any issues, but it also monitors for user load, security and speed, if we are talking about web servers monitoring.
Why monitoring is important?
Monitoring is important because it helps to detect the problem and prevent servers to go down, because any network crashes costs not only money but also time, so monitoring will ensure service availability.
Nagios
Nagios is an open source application for system and networks monitoring and at the same time Nagios is one of the most popular solution for the monitoring.
With the Nagios you are able to:
- Detect problems
- Repair Problems
- Plan system upgrades before outdated system will fail
- Respond to issues as soon as they appeared
- Monitor entire infrastructure
Before You Begin
Check your current Ubuntu version & Upgrade
You can check your current ubuntu version by the following command:
lsb_release -a
If your machine is already running Ubuntu 16.04.1 LTS or higher than that, There is no need for you to upgrade the OS.
Otherwise you need to upgrade the OS by the following command:
sudo apt-get update && sudo apt-get upgrade
Note:
This article is written for a non-root user. Commands that require elevated privileges are prefixed with sudo. If you’re not familiar with the sudo command, you can check the Users and Groups guide.
Install the required package
As a prerequisite, Nagios requires the gcc compiler and build-essentials for the compilation, LAMP (Apache, PHP, MySQL) for the Nagios web interface and Sendmail to send alerts from the server.
To install all those packages, run the following command (it's just 1 line):
sudo apt-get install wget build-essential apache2 php apache2-mod-php7.0 php-gd libgd-dev sendmail unzip
Create Users and Groups
Create a user nagios, and a distinct group nagcmd.
Add nagios and the Apache user www-data, to the nagcmd group in order to run external commands on Nagios through the web interface
Use the following command to create:
To create user:
sudo useradd nagios
To create group:
sudo groupadd nagcmd
To add user to the group:
sudo usermod -a -G nagcmd nagios && sudo usermod -a -G nagcmd www-data
Installing Nagios
Download and extract Nagios
In your web browser, go to the Nagios Core DIY download page.It will ask you to register, If you prefer not to register for updates, click Skip to download.
Under Nagios Core, find the release that says Latest stable release under Notes, then copy the download link to your clipboard.
Now using wget and tar, download the Nagios and extract it.
To download, paste the copied link after wget:
wget https://assets.nagios.com/downloads/nagioscore/releases/nagios-4.2.0.tar.gz
Command to extract:
tar -xzf nagios*.tar.gz
Now move to the newly created directory, by using the following command:
cd nagios-4.2.0
Compile Nagios
Before you build Nagios, you will have to configure it with the user and the group you have created earlier.
command to configure:
./configure --with-nagios-group=nagios --with-command-group=nagcmd
For more information please use: ./configure --help
Now compile Nagios with this command:
make all
To install Nagios
Now we can run these make commands to install Nagios, init scripts, and sample configuration files:
sudo make install
sudo make install-commandmode
sudo make install-init
sudo make install-config
/usr/bin/install -c -m 644 sample-config/httpd.conf /etc/apache2/sites-available/nagios.conf
And copy evenhandler directory to the nagios directory:
sudo cp -R contrib/eventhandlers/ /usr/local/nagios/libexec/
sudo chown -R nagios:nagios /usr/local/nagios/libexec/eventhandlers
Nagios Plugins
Nagios Plugins allow you to monitor services like DHCP, FTP, HTTP and NTP.
Download and extract the Nagios plugins
To use Nagios Plugins, go to Nagios Plugins downloads page and copy the download link for the current stable release.
Now using wget and tar, download and extract Nagios plugin.
Use the following command to move back into user's home directory:
cd ~
To download, paste the copied link after wget:
wget https://nagios-plugins.org/download/nagios-plugins-2.1.2.tar.gz
Command to extract:
tar -xzf nagios-plugins*.tar.gz
Now Change to the newly created directory by the following command:
cd nagios-plugins-2.1.2/
Install Nagios plugins
Install the Nagios plugin's with the following commands:
./configure --with-nagios-user=nagios --with-nagios-group=nagios --with-openssl
make
sudo make install
Configure Nagios
Now let's perform the initial Nagios configuration.
Organize Nagios Configuration
Open the main Nagios configuration file in your favorite text editor(vim/nano).
We'll use nano to edit the file:
sudo nano /usr/local/nagios/etc/nagios.cfg
Now find and uncomment the following line by deleting the #:
#cfg_dir=/usr/local/nagios/etc/servers
Save and exit.
Now create the directory named servers that will store the configuration file for each server that you will monitor:
sudo mkdir /usr/local/nagios/etc/servers
Change the user and group for the new folder to nagios:
sudo chown nagios:nagios /usr/local/nagios/etc/servers

Configure Nagios Contacts
Open the Nagios contacts configuration in your favorite text editor(nano/vim).
We'll use nano to edit the file:
sudo nano /usr/local/nagios/etc/objects/contacts.cfg
Find the email directive, and replace its value with your own email address
Save and exit.
Configuring Apache
Enable Apache modules
Make sure Apache has mod_rewrite and mod_cgi enabled
Enable the Apache rewrite and cgi modules by the following command:
sudo a2enmod rewrite && sudo a2enmod cgi
You can use the htpasswd command to configure a user nagiosadmin for the nagios web interface
sudo htpasswd -c /usr/local/nagios/etc/htpasswd.users nagiosadmin
and type your password.
Enable the Nagios virtualhost
You can enable Nagios Virtualhost by the following command:
sudo ln -s /etc/apache2/sites-available/nagios.conf /etc/apache2/sites-enabled/
Start Apache and Nagios
Start the Apache and Nagios by the following command:
sudo service apache2 restart
sudo service nagios start
When Nagios starts, you may see the following error :
Starting nagios (via systemctl): nagios.serviceFailed
And you can fix it by:
cd /etc/init.d/
sudo cp /etc/init.d/skeleton /etc/init.d/nagios
Now edit the Nagios file by the following command:
sudo nano /etc/init.d/nagios
And add the following code:
DESC="Nagios"
NAME=nagios
DAEMON=/usr/local/nagios/bin/$NAME
DAEMON_ARGS="-d /usr/local/nagios/etc/nagios.cfg"
PIDFILE=/usr/local/nagios/var/$NAME.lock
Make it executable, restart apache2 and start Nagios:
sudo chmod +x /etc/init.d/nagios
sudo service apache2 restart
sudo servuce nagios start
Testing the Nagios Server
Open your favorite web browser, and go to your Nagios server (substitute the IP address or hostname)
(in my case: http://192.168.56.200/nagios).
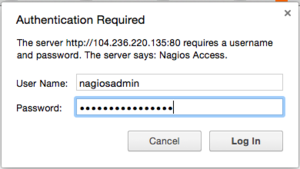
Because we configured Apache to use htpasswd, you must enter the login credentials that you created earlier.
We used "nagiosadmin" as the username:
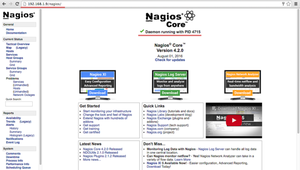
After authenticating, you will be see the default Nagios home page:
In the Homepage, click on the Hosts link, in the left navigation bar, to see which hosts Nagios is monitoring:
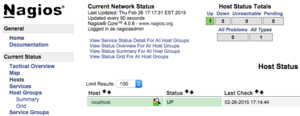
As you can see, Nagios is monitoring only "localhost", or itself.
Let's monitor another host with Nagios!
Adding a Host to Monitor
In this section, you can see how to add a ubuntu host to Nagios server, so it will be monitored.
Note: Here replace the IP with your Nagios server IP and Ubuntu Host IP
In my case:
Nagios Server IP : 192.168.56.200
Ubuntu Host IP : 192.168.56.100
Connect to ubuntu host
You can connect to Ubuntu host by using ssh
If you are not familiar with ssh use this Beginner’s Guide To Setting Up SSH On Linux
ssh student@192.168.56.100
Install NRPE Service
Now install Nagios Plugins and NRPE by following command:
sudo apt-get install nagios-nrpe-server nagios-plugins
Configure NRPE
Now, let's update the NRPE configuration file.
Open it in your favorite editor (we're using nano):
sudo nano /etc/nagios/nrpe.cfg
Find the server_address directive, and add the private IP address of your Nagios server
In my case:
server_address=192.168.56.200
Save and exit.

Restart NRPE
Restart NRPE by following command:
sudo service nagios-nrpe-server restart
Add Ubuntu Host to Nagios Server
connect to the Nagios server:
ssh student@192.168.56.200
Then create a new file for the host configuration in /usr/local/nagios/etc/servers/.
sudo nano /usr/local/nagios/etc/servers/ubuntu_host.cfg
Add the following lines:
# Ubuntu Host configuration file

define host {
        use                          linux-server
        host_name                    ubuntu_host
        alias                        Ubuntu Host
        address                      192.168.1.100
        register                     1
}

define service {
      host_name                       ubuntu_host
      service_description             PING
      check_command                   check_ping!100.0,20%!500.0,60%
      max_check_attempts              2
      check_interval                  2
      retry_interval                  2
      check_period                    24x7
      check_freshness                 1
      contact_groups                  admins
      notification_interval           2
      notification_period             24x7
      notifications_enabled           1
      register                        1
}

define service {
      host_name                       ubuntu_host
      service_description             Check Users
      check_command           check_local_users!20!50
      max_check_attempts              2
      check_interval                  2
      retry_interval                  2
      check_period                    24x7
      check_freshness                 1
      contact_groups                  admins
      notification_interval           2
      notification_period             24x7
      notifications_enabled           1
      register                        1
}

define service {
      host_name                       ubuntu_host
      service_description             Local Disk
      check_command                   check_local_disk!20%!10%!/
      max_check_attempts              2
      check_interval                  2
      retry_interval                  2
      check_period                    24x7
      check_freshness                 1
      contact_groups                  admins
      notification_interval           2
      notification_period             24x7
      notifications_enabled           1
      register                        1
}

define service {
      host_name                       ubuntu_host
      service_description             Check SSH
      check_command                   check_ssh
      max_check_attempts              2
      check_interval                  2
      retry_interval                  2
      check_period                    24x7
      check_freshness                 1
      contact_groups                  admins
      notification_interval           2
      notification_period             24x7
      notifications_enabled           1
      register                        1
}

define service {
      host_name                       ubuntu_host
      service_description             Total Process
      check_command                   check_local_procs!250!400!RSZDT
      max_check_attempts              2
      check_interval                  2
      retry_interval                  2
      check_period                    24x7
      check_freshness                 1
      contact_groups                  admins
      notification_interval           2
      notification_period             24x7
      notifications_enabled           1
      register                        1
}
You can find many check_command in /usr/local/nagios/etc/objects/commands.cfg file. See there if you want to add more services like DHCP, POP etc.
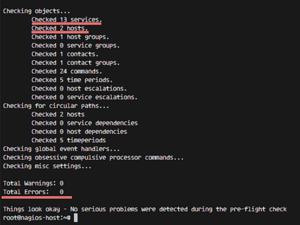
And now check the configuration:
/usr/local/nagios/bin/nagios -v /usr/local/nagios/etc/nagios.cfg
... to see if the configuration is correct.
Restart all services
On the Ubuntu Host start NRPE Service:
sudo service nagios-nrpe-server restart
And on the Nagios server, start Apache and Nagios:
sudo service apache2 restart
sudo service nagios restart
Testing the Ubuntu Host
Open the Nagios server from the browser and see the ubuntu_host being monitored.
The Ubuntu host is available on monitored host.

All services monitored without error.
Summary
Nagios is an open application for systems monitoring. It has several advantages, but main of them are:
- Easy to install and configure
- Easy to to use
- Supports extensions and plugins
Reference
3- Install Nagios and monitor your servers on ubuntu
4- Nagios in 30 minutes and jumpstart your monitoring