Logging and monitoring with Elastic stack on Ubuntu 16.04
Introduction
Logging and monitoring of IT systems is very important part of information security. Proper system logs and monitoring can prevent cyber attacks or service failure. In this wiki we will learn how configure logging and monitoring with ELK stack in Ubuntu server 16.04 and the alternatives of ELK stack Graylogs.
Elasticsearch is an open source search engine based on Lucene, developed in java. It provides a distributed and multitenant full-text search engine with an HTTP Dashboard web-interface (Kibana) and JSON documents scheme. Elasticsearch is a scalable search engine that can be used to search for all types of documents, including log file. Elasticsearch is the heart of the 'Elastic Stack' or ELK Stack.[1]
Logstash is an open source, server-side data processing pipeline that ingests data from a multitude of sources simultaneously, transforms it, and then sends it to Elasticsearch.[2]
Kibana is a data visualization interface for Elasticsearch. Kibana provides a pretty dashboard (web interfaces), it allows you to manage and visualize all data from Elasticsearch on your own. [3]
Prerequisite
Ubuntu 16.04 64 bit server with 4GB of RAM, hostname - elk-master
Ubuntu 16.04 64 bit client with 1 GB of RAM, hostname - elk-client
Following installation steps from 1 to 4 is collected from
Virtual Box setup
As we are going to use Ubuntu server 16.04, which has no Graphical user interface (GUI). It is better to add a GUI client to Ubuntu server and ssh to virtual box setup. Here I will show to how to connect to Ubuntu server from a Ubuntu desktop client via SSH in Virtual box.
Step 1 - Virtual box Networking
- For both Server and Client
- Select the virtual Machine
- go to settings > network
- set Adapter 1 as Internal network (It is better to setup static IP for adapter 1)
- Also Add another network NAT (So the server could have internet access )
Step 2 - Setup static IP in Ubuntu server (elk-master)
- Become a root user sudo -i
- Enable SSH by running following commands[5]
sudo apt-get update
sudo apt-get install openssh-server
sudo ufw allow 22
- Set up static IP
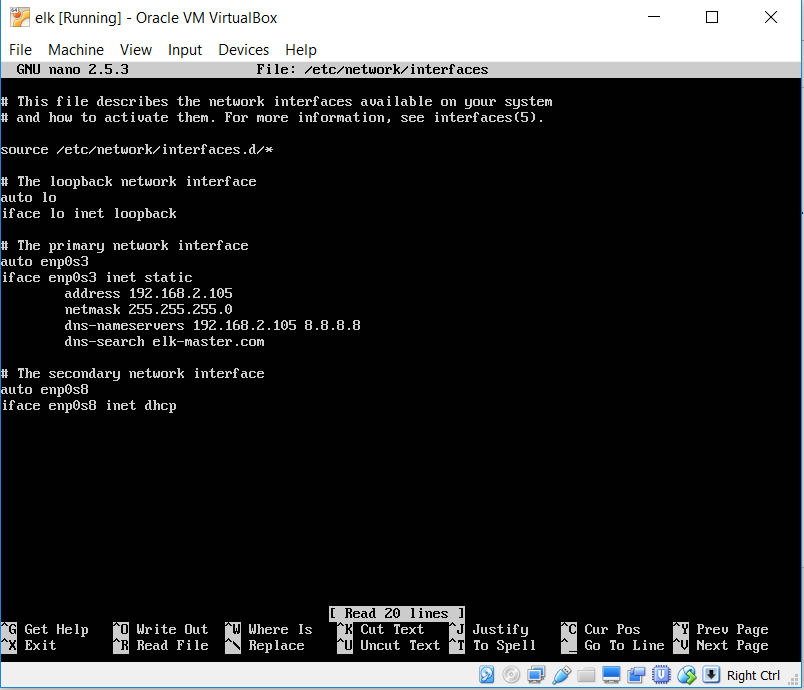
run this command nano /etc/network/interfaces
Now you set a static IP for primary network as screenshot:
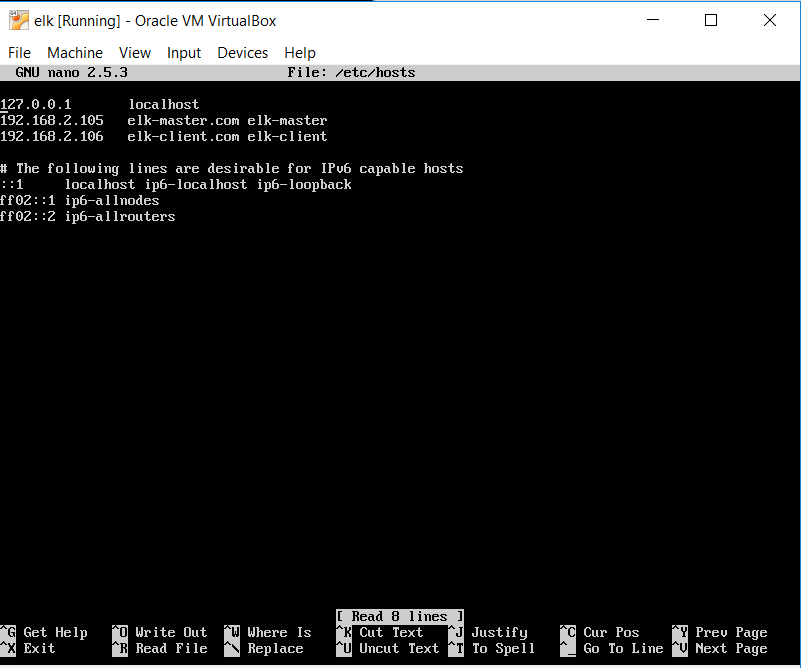
- Now go to nano /etc/hosts
Add IP addresses of elk-master and elk-client as follows:
192.168.2.105 elk-master
192.168.2.106 elk-client
Step 2 - Setup static IP for Ubuntu Desktop(elk-client)
- Open terminal
- log in as root user
- Run following command for Openssh
sudo apt-get update
sudo apt-get install openssh-server
sudo ufw allow 22
- Go to nano /etc/network/interfaces
- Set static IP (example: 192.168.2.106) like ubuntu server
- restart the Ubuntu desktop
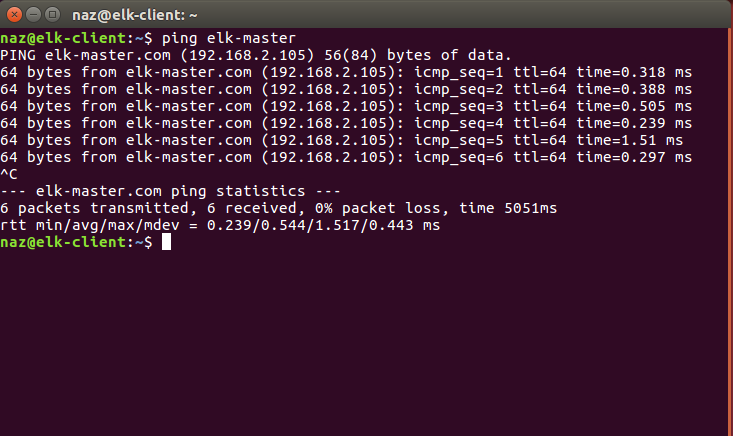
- Now ping ELK-MASTER by running this command
ping elk-master
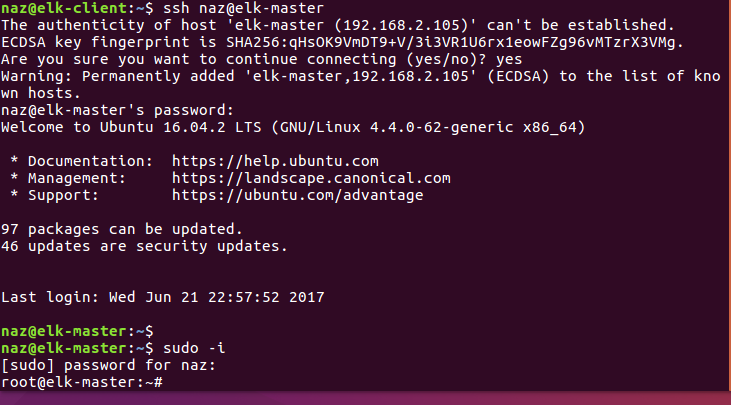
- Connect to elk-master via ssh by this command here naz is the username for elk-master
ssh naz@elk-master
If you have follow the above steps for virtual box, now you are ready to install the ELK stack.
Step 1 - Install Java
Java is required for the Elastic stack deployment. Elasticsearch requires Java 8. It is recommended to use the Oracle JDK 1.8. We will install Java 8 from a PPA repository.
Install the new package 'python-software-properties' so we can add a new repository easily with an apt command.
sudo apt-get update
sudo apt-get install -y python-software-properties software-properties-common apt-transport-https
Add the new Java 8 PPA repository with the 'add-apt-repository' command, then update the repository.
sudo add-apt-repository ppa:webupd8team/java -y
sudo apt-get update
Install Java 8 from the PPA webpub8 repository.
sudo apt-get install -y oracle-java8-installer
Step 2 - Install and Configure Elasticsearch
In this step, we will install and configure Elasticsearch. Install Elasticsearch from the elastic repository and configure it to run on the localhost IP.
Before installing Elasticsearch, add the elastic repository key to the server.
wget -qO - https://artifacts.elastic.co/GPG-KEY-elasticsearch | sudo apt-key add -
Add elastic 5.x repository to the 'sources.list.d' directory.
echo "deb https://artifacts.elastic.co/packages/5.x/apt stable main" | sudo tee -a /etc/apt/sources.list.d/elastic-5.x.list
Update the repository and install Elasticsearch 5.1 with the apt command below.
sudo apt-get update
sudo apt-get install -y elasticsearch
Elasticsearch is installed. Now go to the configuration directory and edit the elasticsaerch.yml configuration file.
cd /etc/elasticsearch/
nano elasticsearch.yml
Enable memory lock for Elasticsearch by removing the comment on line 43. We do this to disable swapping memory for Elasticsearchto avoid overloading the server.
bootstrap.memory_lock: true
In the 'Network' block, uncomment the network.host and http.port lines.
network.host: localhost
http.port: 9200
Save the file and exit nano.
Now edit the elasticsearch service file for the memory lock mlockall configuration.
nano /usr/lib/systemd/system/elasticsearch.service
Uncomment LimitMEMLOCK line.
LimitMEMLOCK=infinity
Save the file and exit.
Edit the default configuration for Elasticsearch in the /etc/default directory.
nano /etc/default/elasticsearch
Uncomment line 60 and make sure the value is 'unlimited'.
MAX_LOCKED_MEMORY=unlimited
Save and exit.
The Elasticsearch configuration is finished. Elasticsearch will run under localhost IP address with port 9200 and we disabled swap memory by enabling mlockall on the Ubuntu server.
Reload the Elasticsearch service file and enable it to run on the boot time, then start the service.
sudo systemctl daemon-reload
sudo systemctl enable elasticsearch
sudo systemctl start elasticsearch
Wait a sec for Elasticsearch to run, then check the open port on the server, make sure the 'state' for port 9200 is 'LISTEN'.
netstat -plntu
Then check the memory lock to ensure that mlockall is enabled. Also check that Elasticsearch is running with the commands below.
curl -XGET 'localhost:9200/_nodes?filter_path=**.mlockall&pretty'
curl -XGET 'localhost:9200/?pretty'
You will see the results below.
Step 3 - Install and Configure Kibana with Nginx
In this step, we will install and configure Kibana behind a Nginx web server. Kibana will listen on the localhost IP address only and Nginx acts as the reverse proxy for the Kibana application.
Install Kibana with this apt command:
sudo apt-get install -y kibana
Now edit the kibana.yml configuration file.
nano /etc/kibana/kibana.yml
Uncomment the server.port, server.hos and elasticsearch.url lines.
server.port: 5601
server.host: "localhost"
elasticsearch.url: "http://localhost:9200"
Save the file and exit nano.
Add Kibana to run at boot and start it.
sudo systemctl enable kibana
sudo systemctl start kibana
Kibana will run on port 5601 as node application.
netstat -plntu
Kibana installation is done, now we need to install Nginx and configure it as a reverse proxy to be able to access Kibana from the public IP address.
Next, install the Nginx and apache2-utils packages.
sudo apt-get install -y nginx apache2-utils
Apache2-utils is a package that contains tools for the webserver that work with Nginx as well, we will use htpasswd basic authentication for Kibana.
Nginx has been installed. Now we need to create a new virtual host configuration file in the Nginx sites-available directory. Create a new file 'kibana' with nano.
cd /etc/nginx/
vim sites-available/kibana
Paste configuration below.
server {
    listen 80;

    server_name elk-stack.co;

    auth_basic "Restricted Access";
    auth_basic_user_file /etc/nginx/.kibana-user;

    location / {
        proxy_pass http://localhost:5601;
        proxy_http_version 1.1;
        proxy_set_header Upgrade $http_upgrade;
        proxy_set_header Connection 'upgrade';
        proxy_set_header Host $host;
        proxy_cache_bypass $http_upgrade;
    }
}
Save the file and exit nano
Create a new basic authentication file with the htpasswd command.
sudo htpasswd -c /etc/nginx/.kibana-user admin
TYPE YOUR PASSWORD
Activate the kibana virtual host by creating a symbolic link from the kibana file in 'sites-available' to the 'sites-enabled' directory.
ln -s /etc/nginx/sites-available/kibana /etc/nginx/sites-enabled/
Test the nginx configuration and make sure there is no error, then add nginx to run at boot time and restart nginx.
nginx -t
systemctl enable nginx
systemctl restart nginx
Step 4 - Install and Configure Logstash
In this step, we will install and configure Logsatash to centralize server logs from client sources with filebeat, then filter and transform all data (Syslog) and transport it to the stash (Elasticsearch).
Install Logstash 5 with the apt command below.
sudo apt-get install -y logstash
Edit the hosts file with nano.
nano /etc/hosts
Add the server IP address and hostname.
10.0.2.15 elk-master
Save the hosts file and exit the editor.
Now generate a new SSL certificate file with OpenSSL so the client sources can identify the elastic server.
cd /etc/logstash/
openssl req -subj /CN=elk-master -x509 -days 3650 -batch -nodes -newkey rsa:4096 -keyout logstash.key -out logstash.crt
Change the '/CN' value to the elastic server hostname.
Certificate files will be created in the '/etc/logstash/' directory.
Next, we will create the configuration files for logstash. We will create a configuration file 'filebeat-input.conf' as input file from filebeat, 'syslog-filter.conf' for syslog processing, and then a 'output-elasticsearch.conf' file to define the Elasticsearch output.
Go to the logstash configuration directory and create the new configuration files in the 'conf.d' directory.
cd /etc/logstash/
nano conf.d/filebeat-input.conf
Input configuration, paste configuration below.
input {
  beats {
    port => 5443
    type => syslog
    ssl => true
    ssl_certificate => "/etc/logstash/logstash.crt"
    ssl_key => "/etc/logstash/logstash.key"
  }
}
Save and exit.
Create the syslog-filter.conf file.
nano conf.d/syslog-filter.conf
Paste the configuration below.
filter {
  if [type] == "syslog" {
    grok {
      match => { "message" => "%{SYSLOGTIMESTAMP:syslog_timestamp} %{SYSLOGHOST:syslog_hostname} %{DATA:syslog_program}(?:\[%{POSINT:syslog_pid}\])?: %{GREEDYDATA:syslog_message}" }
      add_field => [ "received_at", "%{@timestamp}" ]
      add_field => [ "received_from", "%{host}" ]
    }
    date {
      match => [ "syslog_timestamp", "MMM  d HH:mm:ss", "MMM dd HH:mm:ss" ]
    }
  }
}
We use a filter plugin named 'grok' to parse the syslog files.
Save and exit.
Create the output configuration file 'output-elasticsearch.conf'.
nano conf.d/output-elasticsearch.conf
Paste the configuration below.
output {
  elasticsearch { hosts => ["localhost:9200"]
    hosts => "localhost:9200"
    manage_template => false
    index => "%{[@metadata][beat]}-%{+YYYY.MM.dd}"
    document_type => "%{[@metadata][type]}"
  }
}
Save and exit.
When this is done, add logstash to start at boot time and start the service.
sudo systemctl enable logstash
sudo systemctl start logstash
Alternatives of ELK stack (Graylog2)
Graylog is a powerful tool for logs management that gives you lots of options on analyzing incoming logs from different servers. The way Graylog works is pretty much similar to ELK. In addition to the very Graylog server, which consists of the application and the web interface server, you will also need to have MongoDB and Elasticsearch in order to make the whole stack fully operable. [6]
ELK stack vs Graylog2
ELK stack and Graylog both almost same in terms of features. Graylog can’t read from syslog files, so you need to send your messages to Graylog directly.[7]. Logstash’s weak spot has always been performance and resource consumption. Graylog also has built is user permissions management, this feature is not available in Kibana. In Graylog you can also configure it to receive alerts via emails. Graylog uses good-ol REST API.


