Sguil: Difference between revisions
No edit summary |
|||
| Line 262: | Line 262: | ||
=See also= | =See also= | ||
* [https://en.wikipedia.org/wiki/Sagan_(software) Sagan] | |||
* [ | * [https://en.wikipedia.org/wiki/Intrusion_detection_system IDS] | ||
* [ | * [https://en.wikipedia.org/wiki/Intrusion_prevention_system IPS] | ||
* [ | * [https://en.wikipedia.org/wiki/Metasploit_Project Metasploit Project] | ||
* [ | * [https://en.wikipedia.org/wiki/Nmap NMAP] | ||
* [ | * [https://www.snort.org/ SNORT] | ||
* [ | * [https://www.bro.org/ BRO] | ||
=References= | =References= | ||
*[http://sguil.sourceforge.net Sguil Homepage] | *[http://sguil.sourceforge.net Sguil Homepage] | ||
Revision as of 20:56, 6 June 2016

Author: Kustas Kurval
Cyber Security Engineering C11
Written 06.06.2016
Introduction
This tutorial was made to make an introduction to Sguil. Sguil (pronounced sgweel) is built by network security analysts for network security analysts. It is a collection of free software components for Network Security Monitoring (NSM) and event driven analysis of IDS alerts. Sguil's main component is an intuitive GUI that provides access to realtime events, session data, and raw packet captures. Sguil facilitates the practice of Network Security Monitoring and event driven analysis.
The Sguil client is written in tcl / tk and can be run on any operating system that supports tcl / tk (including Linux, *BSD, Solaris, MacOS, and Win32).
It is provided by Q Public License
Sguil integrates alert data from Snort, session data from SANCP, and full content data from a second instance of Snort running in packet logger mode.
In this introduction I will be covering Sguil in Xbuntu. You will need to know basic Linux syntax and terminology also some terminology concerning overall intrusion detection and prevention systems (IDPS) and overall basic networking.
Software architecture
A sguil system is composed of a single sguil server and an arbitrary number of sguil network sensors. The sensors perform all the security monitoring tasks and feed information back to the server on a regular basis. The server coordinates this information, stores it in a database and communicates with sguil clients running on administrators' desktop machines. It can also issue requests for specific information from the sensors.
Each sensor monitors a single network link (although you can have multiple sensors on one physical machine). They collect several different types of information:
                                           |<---------> Sensor #1
           Client  ==>  Server <=========> |<---------> Sensor #2
                                           |<---------> Sensor #3
- Snort monitors the link for security events, and logs them to a file on the local disk.
- Barnyard takes events from the snort log file and sends them to the sensor agent, which inserts them into database running on the sguil server in near real-time
- A separate instance of snort logs the full content of all network packets to the local disk (this typically requires a large separate data partition)
- SANCP records TCP/IP sessions and forwards them to the database on the sguil server
- The sguil agent also listens for commands from the sguil server. These commands are typically requests for packet data previously logged by Snort.
Contents
Since Sguil is dependant on many other types of software to gather, facilitate, store ,decode and analyze I will be using Xbuntu based distribution Security Onion which saves massive amount of time to set up the entire environment. Security Onion has all this and more build in and is able to quickly configure which software to tie to Sguil.
Dependencies
Hardware
The hardware necessary to run sguil depends entirely upon the amount of network traffic you plan to monitor, how much of it you store and how long you store it. The public demonstration server at demo.sguil.net gets by with a 133MHz Pentium system, though for production systems you'll want something beefier.
For the sguil server, try to find something with a lot of memory and a fast disk. The MySQL database will need a lot of RAM for caching results from its queries, and a fast disk will speed up the access time while doing sequential searches.
You may find it helpful to place the MySQL storage on a separate disk partition, or even a separate disk. It doesn't matter where you mount this storage area, but for convenience, I'll assume that that you're going to mount it on the same directory path you're using for the sensor data directory (see below), referred to in this document as $NSM.
The following table is a useful guideline for a good server hardware configuration. Feel free to adjust it up or down depending on the size of your installation.
| CPU | RAM | Disk Storage |
|---|---|---|
| 3.0GHz | 2GB | 150GB (Consider a RAID5 array for speed & reliability) |
Software
Tools that usually make up Sguil
| Tool | Purpose |
|---|---|
| MySQL 4.x or 5.x | Data storage and retrieval |
| Snort 2.x / Suricata | Intrusion detection alerts, scan detection, packet logging |
| Barnyard / Barnyard2 | Decodes IDS alerts and sends them to sguil |
| SANCP | TCP/IP session records |
| Tcpflow | Extract an ASCII dump of a given TCP session |
| p0f | Operating system fingerprinting |
| tcpdump | Extracts individual sessions from packet logs |
| Wireshark | Packet analysis tool (used to be called Ethereal) |
Setup
- First, review the Hardware Requirements page.
- Review the Release Notes page.
- Download and verify our Security Onion ISO image.
- Boot the ISO image and select the Install option.
I Installed this on Oracle Virutalbox as a 64 bit Ubuntu operating system, with 4GB of memory and a single processor. I set the network adapter as bridged with promiscuous mode allowed. This ensured that I am able to capture network traffic from the host machine
- Follow the prompts in the Xubuntu installer. If prompted with an encrypt home folder or encrypt partition option, DO NOT enable this feature. If asked about * * * automatic updates, DO NOT enable automatic updates. Reboot into your new installation. Login using the username/password you specified during installation.
- Verify that you have Internet connectivity. If necessary, configure your proxy settings.
- Install updates and reboot.
- Double-click the Setup icon on the desktop. The Setup wizard will walk you through configuring /etc/network/interfaces and will then reboot.
- After rebooting, log back in and start the Setup wizard again. It will detect that you have already configured /etc/network/interfaces and will walk you through the rest of the configuration. When prompted for Evaluation Mode or Production Mode, choose Evaluation Mode.
Security Onion usually expects at least two networking interfaces. One for monitoring the other for management. Since I only had access to a single interface on the virtual machine I set it as management. I used the static IP address 192.168.1.111 with regular /24 subnet mask for ease of use. After this I was prompted for a gateway address and DNS server.
- Once you've completed the Setup wizard, use the Desktop icons to login to Sguil.
Post Installation
Verify services are running:
sudo service nsm status
If any services are not running, try starting them:
sudo service nsm start
Tuning / Miscellaneous
- Are you monitoring network traffic that has VLAN tags? If so, take a look at our VLAN page.
- If you’re monitoring IP address ranges other than private RFC1918 address space (192.168.0.0/16, 10.0.0.0/8, 172.16.0.0/12), you should update your sensor configuration with the correct IP ranges. Sensor configuration files can be found in
/etc/nsm/$HOSTNAME-$INTERFACE/. Modify eithersnort.conforsuricata.yaml(depending on which IDS engine you chose duringsosetup) and update theHOME_NETvariable. Also update the home_nets variable inprads.conf. Then update Bro’s network configuration in/opt/bro/etc/networks.cfg. Restart the sensor processes:
sudo nsm_sensor_ps-restart
- If you have Internet access, create an IDS alert by typing the following at a terminal:
curl http://testmyids.com
- As of securityonion-setup - 20120912-0ubuntu0securityonion201, Setup now defaults to only opening port 22 in the firewall. If you need to connect OSSEC agents, syslog devices, or analyst VMs, you can run the new
so-allowutility which will walk you through creating firewall rules to allow these devices to connect. For more information, please see the firewall page. - Full-time analysts should install Security Onion in a VM on their workstation (run through the Ubuntu installer, but do not run our Setup wizard). This gives you a local copy of Wireshark, NetworkMiner, and our customized Sguil client. Launch the Sguil client and connect to the IP/hostname of your production Sguil sensor (you may need to run so-allow as described in the previous step). This allows you to investigate pcaps without fear of impacting your production server/sensors. To change the resolution of your Security Onion VM, install the Virtual Tools for your virtualization solution or use xrandr. For a list of available screen resolutions, simply execute “xrandr”. To set the screen resolution (replace W and H with the actual Width and Height desired):
xrandr -s WxH
- Login to Sguil and review your IDS alerts. Squert and ELSA can be accessed by visiting https://server/ for additional in-depth analysis.
- Run the following to see how your sensor is coping with the load. You should check this on a daily basis to make sure your sensor is not dropping packets. Consider adding it to a cronjob and having it emailed to you (see the “configure email” link below).
sudo sostat | less
- Please note that any IDS/NSM system needs to be tuned for the network it’s monitoring. Please see ManagingAlerts. You should only run the signatures you really care about.
- Also note that you should be looking at and categorizing events every day with the goal being to categorize all events every day. Even if you don’t use the Sguil console for your primary analysis, you need to log into it periodically and F8 old events to keep the real time queue from getting too big. Neglecting to do so will result in database/Sguil issues as the number of uncategorized events continues to increase on a daily basis. Please see the Sguil client page on NSMwiki.
- On the server running the Sguil database, set the
DAYSTOKEEPvariable in/etc/nsm/securityonion.confto however many days you want to keep in your archive. The default is 30, but you may need to adjust it based on your organization’s detection/response policy and your available disk space. - If you enabled http_agent, you should tune it using http_agent.conf. If you're running ELSA, you already have all the Bro HTTP logs available there, so you might want to disable http_agent to avoid duplicating those logs in the Sguil database:
# Terminate the running http_agent
sudo nsm_sensor_ps-stop --only-http-agent
# Disable http_agent
sudo sed -i 's|HTTP_AGENT_ENABLED="yes"|HTTP_AGENT_ENABLED="no"|g' /etc/nsm//sensor.conf
- Disable any unneeded sensor processes
- Tune the number of PF_RING instances for Snort/Suricata and Bro: PF_RING
- Optional:* exclude unnecessary traffic from your monitoring using BPF.
- Optional: add new Sguil user accounts with the following:
sudo nsm_server_user-add
- Optional, but highly recommended: configure Email for alerting and reporting.
- Optional, but highly recommended: place /etc under version control. If your organization doesn't already have a standard version control tool, you can use bazaar, git, etckeeper:
sudo apt-get install etckeeper
- Optional: need “remote desktop” access to your Security Onion sensor or server? We recommend SSH X-Forwarding as shown above, but if you want something more rdp-like, you can install FreeNX or xrdp:
sudo apt-get install xrdp
Please note that we do not support FreeNX or xrdp.
- Read more about the tools contained in Security Onion: Tools
Using Sguil
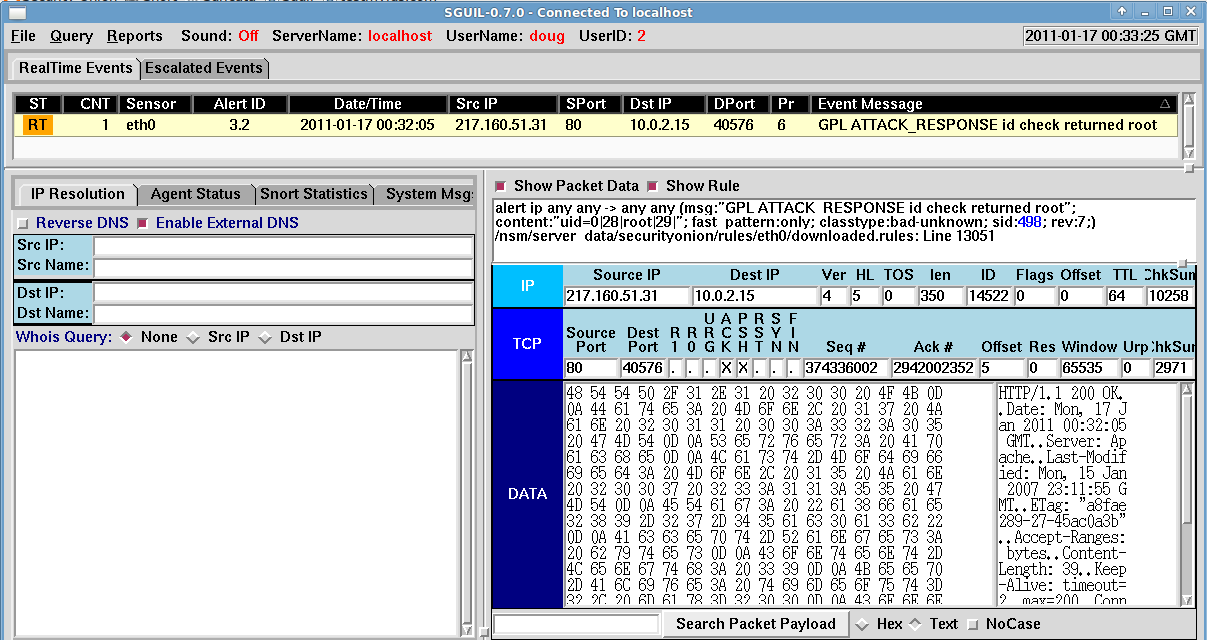
- Double-click the Sguil desktop icon. Log into Sguil using the username/password you specified in the previous step. There may already be some alerts in the Sguil console. If not, open Firefox and click the testmyids.com bookmark and you should then see an alert appear in Sguil.
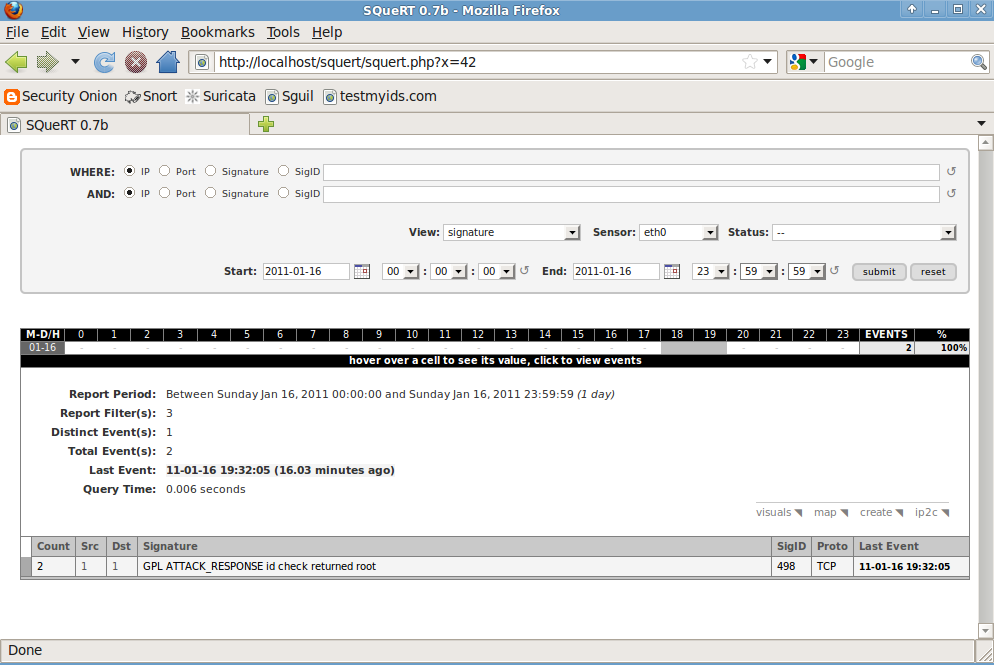
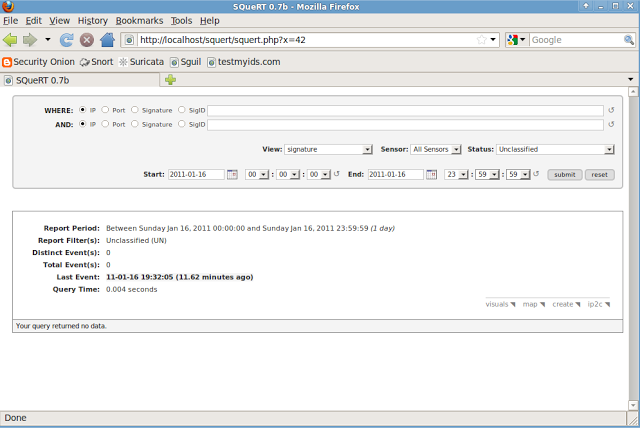
- Double-click the Squert desktop icon. The Squert main page appears. Click the "submit" button. Snort alerts appear at the bottom of the page and they should match what you saw in Sguil.
- Go back to Sguil, select an alert, and press the F8 key to expire it. Notice that the alert disappears from Sguil.
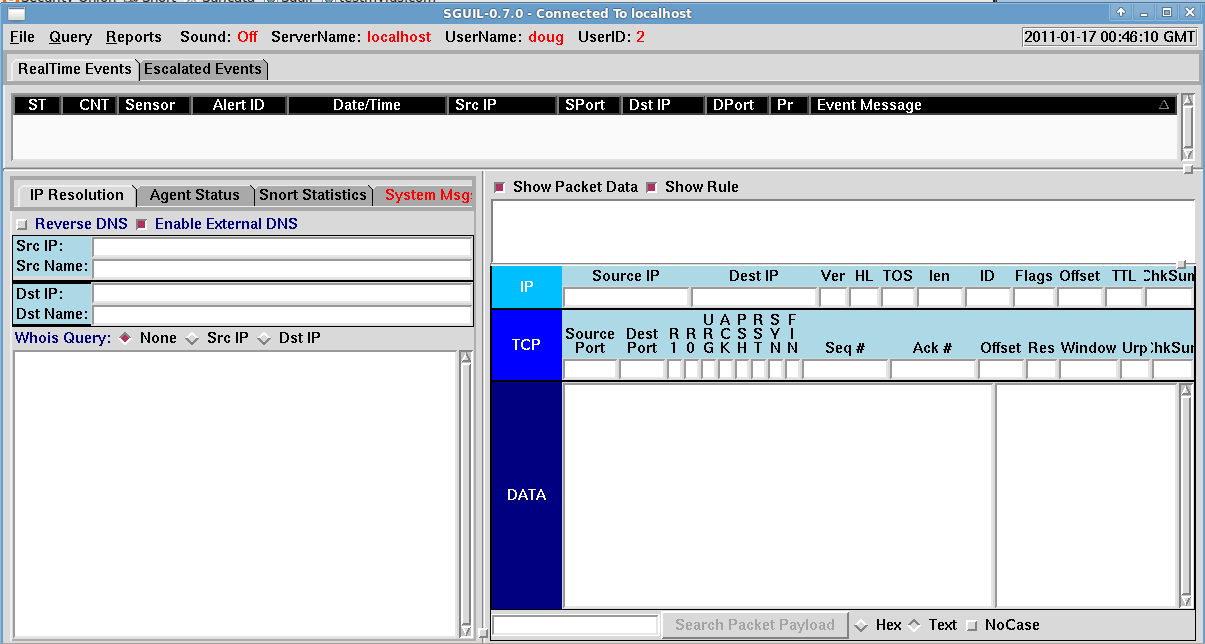
- Go back to Squert and click the "submit" button again. Notice that the alert remains in Squert. Sguil's main console shows events that have not yet been classified, so we need to tell Squert to do the same. Click the "Status" drop-down box and select "Unclassified". Click the "submit" button and notice that the alert is now gone.
How do I set up sguil to automatically categorize incoming alerts?
This is called "automatic categorization", or just "autocat" for short. Take a look at /etc/sguild/autocat.conf, which contains full instructions. Once you edit this file, you'll need to restart sguild in order for the changes to take effect.
NOTE: Be sure you are running sguild with the proper "-a" flag!
Can sguil page me when it sees a particular alert?
Yes, using the sguild.email file on the sguild server (for version 0.6
and higher).  Note that the file is only read on init, and reread on
HUP signals, so if you make changes to it, you'll need to restart
sguild.

Set-up is fairly straightforward, as the file is very well documented.

To activate:
	set EMAIL_EVENTS 1
	set SMTP_SERVER {your_mail_server}
	set EMAIL_RCPT_TO "recipient1@mydomain.com,recipient2@mydomain.com"
	set EMAIL_FROM "sguil@mydomain.com"

Modify your notification options to meet your needs:

	set EMAIL_CLASSES "successful-admin trojan-activity attempted-admin attempted-user"
	set EMAIL_PRIORITIES "0"

Optionally, use the last two parameters, EMAIL_DISABLE_SIDS and
EMAIL_ENABLE_SIDS to override any specific sids you'd like.

Restart sguild to complete.
By the way, the procedure for 0.5.3 and previous releases is very similar, except that the email configuration is included directly in the sguild.conf file instead.
How do I expire (purge) old information from the database?
Sguil 0.5.3 comes with a handy script for this, called archive_sguildb.tcl. Basic usage looks like this:
archive_sguildb.tcl -d 2004-12-27 -p 2004_12_27_ --dbname sguildb \
       --dbhost localhost --dbuser sguil --dbpass password --event \
	--session --sancp
This command would expire all event, session and SANCP entries older than "2004-12-27", placing them in new tables called "2004_12_27_event", "2004_12_27_session" and "2004_12_27_sancp". You can drop these tables if you don't want the data, or you can keep them around in case you need to make historical queries. As long as you have the disk space to store them, these older tables do not affect the performance of queries running against the current tables.
After expiring old date, you should also run mysqlcheck to re-optimize the database, reindex and repair tables and to reclaim the space used by the expired data.
Be warned that expiring old data may take hours on a large database (especially the sessions and SANCP tables). This can temporarily lock tables in the db, which will interfere with queries and with insertions. The sensors will queue up their data and try again when the table is unlocked, but interactive use might suffer. It's probably best to run these overnight when no one is using the GUI.
For sguil 0.5.3, you might also want to try out David Bianco's sguil_age_db script, which is a wrapper for archive_sguildb.tcl. The script's advantage is that it doesn't require you to give an absolute date for the expiration time, and you can specify different thresholds for different tables. For example:
sguil_age_db --event "-27 days" --session "-3 weeks" --sancp "-1 month"
This makes it a little more suitable for running out of cron.
Sguil 0.6.0 and above changes the database schema extensively, and the archive script is no longer necessary. This version uses MERGE tables to create "virtual tables" for events, SANCP records and other supporting information. The virtual tables are comprised of a number of individual tables, one for each day. The table names look something like "tablename_sensorname_date" (e.g., "sancp_externalnet_20051128", "event_finance_20051031" or "data_finance_20051031"). The sguil server creates the merged tables dynamically, so you'll find "event", "icmphdr", "tcphdr", "udphdr", "data" and "sancp" tables, along with all the individual daily tables that make up these merged tables.
Given this, if you want to get rid of old data, simply stop the sguil server, drop the daily tables you don't want, drop the merged tables, then restart the sguil server. Sguil will recreate the merged tables using the remaining data in the database.
Here is a handy bash shell script that will automate this process and also repairs any remaining tables to keep data corruption to a minumum:
#! /bin/bash

DATABASE=sguildb
DB_USER=sguil
DB_PASSWORD=password
DAYSTOKEEP=45

KEEPDAY=`/usr/bin/mysql -u$DB_USER -p$DB_PASSWORD -BN -e "SELECT DATE_FORMAT(DATE_SUB(NOW(), INTERVAL $DAYSTOKEEP DAY), '%Y%m%d');" -D $DATABASE`

/sbin/service sguild stop

for TABLEPREFIX in "data" "event" "icmphdr" "sancp" "tcphdr" "udphdr"
do
	/usr/bin/mysql -u$DB_USER -p$DB_PASSWORD -BN -e "DROP TABLE $TABLEPREFIX;" -D $DATABASE
	TABLES=(`/usr/bin/mysql -u$DB_USER -p$DB_PASSWORD -BN -e "SHOW TABLES LIKE '$TABLEPREFIX%';" -D $DATABASE`)
	for TABLE in "${TABLES[@]}"
	do
		TABLEDAY=`echo "$TABLE" | awk -F_ '{print($3)}'`
		if [ "$TABLEDAY" -lt "$KEEPDAY" ]
			then /usr/bin/mysql -u$DB_USER -p$DB_PASSWORD -BN -e "DROP TABLE $TABLE;" -D $DATABASE
		else
			/usr/bin/mysql -u$DB_USER -p$DB_PASSWORD -BN -e "REPAIR TABLE $TABLE;" -D $DATABASE
		fi
	done
done

/sbin/service sguild start
What commands are available in the "User Messages" window?
Most people probably don't realize this, but the client's User Messages window is good for more than just user-to-user chat. It also offers a few simple commands you can use to check the status of the sguil sensors and server. To use one of the commands, simply type it on a line by itself in the User Message tab.
Version 0.5.3 supports the following commands:
| Command | Purpose |
|---|---|
| agents | Lists all the sensor agents connected to sguild. This is deprecated, but still supported. |
| healthcheck | Like the "agents" command, but more comprehensive. It also checks each agent to make sure it is still actively responding to requests. Unlike the other commands, the output for this is displayed in the "System Messages" tab. This is also deprecated, since the 0.6.0 client now includes a handy "Sensor Status" panel. |
| sensors | An alias for the "agents" command. |
| who | List all users connected to sguild. |
I'm not satisfied with the default packet logging subsystem. Are there any alternatives available?
Yes. Two alternatives have already been developed, based on [[DaemonLogger] and SANCP. See Packet Logging in Sguil for more information on this subsystem and the alternatives available.
Summary
Sguil is a superb software to combine together a very large amount of IDS information while keeping every it sorted and very easily manageable. Additional tools in Security Onion also help to set up custom configuration with all analysis software a few clicks away. This gives a lot of possibility for automation of deep packet analysis. Clean installation and configuration of Sguil with all its dependencies is quite time consuming for a newcomer. But Security Onion can reduce this very to a reasonable time frame.
See also
References
- Sguil Homepage
- Sguil FAQ
- NSMWiki: The official wiki for the Sguil project.
- Security Onion homepage
- Wikipedia Sguil
- Security Onion Github Wiki