Sguil: Difference between revisions
No edit summary |
|||
| Line 79: | Line 79: | ||
* Once you've completed the Setup wizard, use the Desktop icons to login to Sguil. | * Once you've completed the Setup wizard, use the Desktop icons to login to Sguil. | ||
=== | ===Post Installation=== | ||
===Examples=== | ===Examples=== | ||
Revision as of 19:39, 6 June 2016


Author: Kustas Kurval
Cyber Security Engineering C11
Written 06.06.2016
Introduction
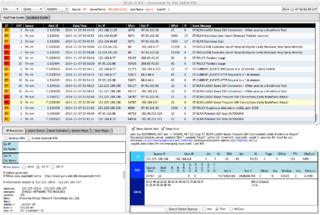
This tutorial was made to make an introduction to Sguil. Sguil (pronounced sgweel) is built by network security analysts for network security analysts. It is a collection of free software components for Network Security Monitoring (NSM) and event driven analysis of IDS alerts. Sguil's main component is an intuitive GUI that provides access to realtime events, session data, and raw packet captures. Sguil facilitates the practice of Network Security Monitoring and event driven analysis.
The Sguil client is written in tcl / tk and can be run on any operating system that supports tcl / tk (including Linux, *BSD, Solaris, MacOS, and Win32).
It is provided by Q Public License
Sguil integrates alert data from Snort, session data from SANCP, and full content data from a second instance of Snort running in packet logger mode.
In this introduction I will be covering Sguil in Xbuntu. You will need to know basic Linux syntax and terminology also some terminology concerning overall intrusion detection and prevention systems (IDPS) and overall basic networking.
Software architecture
A sguil system is composed of a single sguil server and an arbitrary number of sguil network sensors. The sensors perform all the security monitoring tasks and feed information back to the server on a regular basis. The server coordinates this information, stores it in a database and communicates with sguil clients running on administrators' desktop machines. It can also issue requests for specific information from the sensors.
Each sensor monitors a single network link (although you can have multiple sensors on one physical machine). They collect several different types of information:
- Snort monitors the link for security events, and logs them to a file on the local disk.
- Barnyard takes events from the snort log file and sends them to the sensor agent, which inserts them into database running on the sguil server in near real-time
- A separate instance of snort logs the full content of all network packets to the local disk (this typically requires a large separate data partition)
- SANCP records TCP/IP sessions and forwards them to the database on the sguil server
- The sguil agent also listens for commands from the sguil server. These commands are typically requests for packet data previously logged by Snort.
Tools that usually make up Sguil
| Tool | Purpose |
|---|---|
| MySQL 4.x or 5.x | Data storage and retrieval |
| Snort 2.x / Suricata | Intrusion detection alerts, scan detection, packet logging |
| Barnyard / Barnyard2 | Decodes IDS alerts and sends them to sguil |
| SANCP | TCP/IP session records |
| Tcpflow | Extract an ASCII dump of a given TCP session |
| p0f | Operating system fingerprinting |
| tcpdump | Extracts individual sessions from packet logs |
| Wireshark | Packet analysis tool (used to be called Ethereal) |
Contents
Since Sguil is dependant on many other types of software to gather, facilitate, store ,decode and analyze I will be using Xbuntu based distribution Security Onion which saves massive amount of time to set up the entire environment. Security Onion has all this and more build in and is able to quickly configure which software to tie to Sguil.
Dependencies
Hardware
Software
Setup
- First, review the Hardware Requirements page.
- Review the Release Notes page.
- Download and verify our Security Onion ISO image.
- Boot the ISO image and select the Install option.
I Installed this on Oracle Virutalbox as a 64 bit Ubuntu operating system, with 4GB of memory and a single processor. I set the network adapter as bridged with promiscuous mode allowed. This ensured that I am able to capture network traffic from the host machine
- Follow the prompts in the Xubuntu installer. If prompted with an encrypt home folder or encrypt partition option, DO NOT enable this feature. If asked about * * * automatic updates, DO NOT enable automatic updates. Reboot into your new installation. Login using the username/password you specified during installation.
- Verify that you have Internet connectivity. If necessary, configure your proxy settings.
- Install updates and reboot.
- Double-click the Setup icon on the desktop. The Setup wizard will walk you through configuring /etc/network/interfaces and will then reboot.
- After rebooting, log back in and start the Setup wizard again. It will detect that you have already configured /etc/network/interfaces and will walk you through the rest of the configuration. When prompted for Evaluation Mode or Production Mode, choose Evaluation Mode.
Security Onion usually expects at least two networking interfaces. One for monitoring the other for management. Since I only had access to a single interface on the virtual machine I set it as management. I used the static IP address 192.168.1.111 with regular /24 subnet mask for ease of use. After this I was prompted for a gateway address and DNS server.
- Once you've completed the Setup wizard, use the Desktop icons to login to Sguil.
Post Installation
Examples
Summary
See also
- Sagan
- Intrusion detection system (IDS)
- Intrusion prevention system (IPS)
- Network intrusion detection system (NIDS)
- Metasploit Project
- nmap
References
- Sguil Homepage
- Sguil FAQ
- NSMWiki: The official wiki for the Sguil project.